
At Pure Storage, most of our Splunk customers who chose FlashArrays and/or FlashBlades to host their critical applications also chose Splunk as their preferred choice for monitoring.
The monitoring platform allows Organizations for a proactive response, supports their Security Information and Event Management (SIEM), improves their Operations, and helps in issue identification and troubleshooting. For an effective monitoring platform, having all relevant machine logs and metrics from various infrastructure and applications in a unified platform is a key requirement.
To collect machine logs and metrics into Splunk from various devices and applications, there are numerous Splunk Technology Add-on (TA) available at splunkbase.splunk.com, an app store equivalent for the Splunk community. A Splunk Technology add-on (TA) is a type of app that is generally used for getting data in, mapping data, or providing saved searches and macros. The TA is a pull model where the logs or metrics are pulled from the infrastructure or application periodically by the Splunk instance where the TA is installed.
A Splunk App is a prebuilt collection of dashboards, panels, and UI elements packaged for a specific infrastructure or application, like Splunk App for Cisco Firewall or for a specific use case like Splunk App for PCI Compliance. Hence it is not uncommon to see a pair of an add-on and an app for every infrastructure or application component. Generally these add-ons and apps are developed by the respective vendors.
To support our Splunk customers to extract the monitoring details like performance metrics, alerts, logs from their Pure Storage appliances, like FlashArray and FlashBlade, into their Splunk environment we have published the following add-ons and apps at splunkbase.splunk.com.
Technology Add-on
- FlashArray – PureStorage-TA
- FlashBlade – PureStorage FlashBlade Add-on for Splunk
Splunk App
- FlashArray – PureStorage-App
- FlashBlade – PureStorage FlashBlade App for Splunk
This is the first part of the two-part blog series where I will go over the current challenges in handling numerous appliances with the Splunk TA and how Pure can help optimize Splunk TA by using Pure1.
The following diagram shows the current Pure Storage Splunk TA and App architecture.
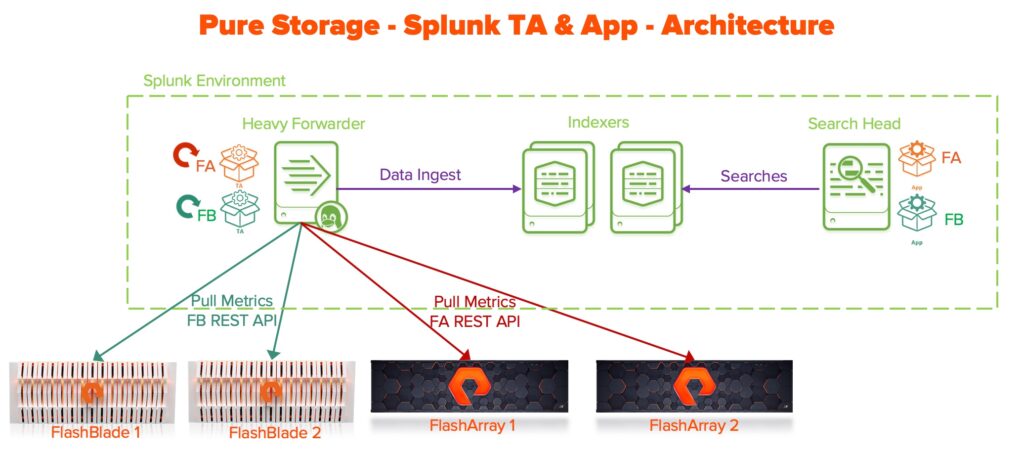
As you can see from the above diagram, a separate TA for FlashArray and FlashBlade is set up generally on the forwarders. Within each TA, each appliance is configured as a separate input with an interval.
Once the inputs are configured, Splunk invokes the data collection module individually for every appliance at the configured interval. So if a customer has configured 2 FlashArrays, 2 FlashBlades and scheduled them to be collected every 15 minutes, Splunk will be running 4 data collections across those 4 appliances periodically.
But what about the customers who have hundreds of appliances? While the initial setup process itself might be very tedious, error-prone, and time-consuming, it is the periodic collection that would be adding overhead to the Splunk processes. Splunk has to run hundreds of those data collection modules periodically to extract the monitoring information from these appliances which means more latency in scheduling hundreds of jobs and eventually running them. This is the conventional working model currently being followed by various Splunk customers.
Is this the best way to get metrics from numerous appliances?
No, certainly not but this was the only available option.
Is there an alternative to help Pure customers?
Yes, there is a much simpler and an efficient way to get metrics from all the Pure Storage appliances through Pure’s offering of Pure1 REST API.
Pure Storage customers who are used to Pure1, the cloud-based Fleet Management platform, that allows the customers to manage all their Pure Storage products in one place can unleash the power of integrations with Pure1 REST API and can extract metrics from all the Pure Storage appliances in one go.
To explain the difference between the current implementation and the Pure1 way, let us take an example.
Let us assume a customer has 50 FlashArrays and 50 FlashBlades. To get the array details from all their appliances, they have to issue 100 REST API calls (50 FA REST API calls and 50 FB REST API calls).
With Pure1, to get the array details from all their FlashArrays and FlashBlades, all they have to do is to issue a single Pure1 REST API call against the Array endpoint. With just a single Pure1 REST API call, they can get all their fleet’s array details which would have taken 100 REST API calls in the conventional model.
Based on the request from some of our customers, we are planning to extend our Splunk TA to support Pure1 REST API to improve the data collection process as well as reduce the operational burden in managing numerous inputs.
The following diagram shows the proposed Splunk TA & app architecture using Pure1.
Note: This is purely a preview with no firm timeline on this new TA. The final design of the App and TA might change but not the fundamental advantage of the Pure1 REST API.
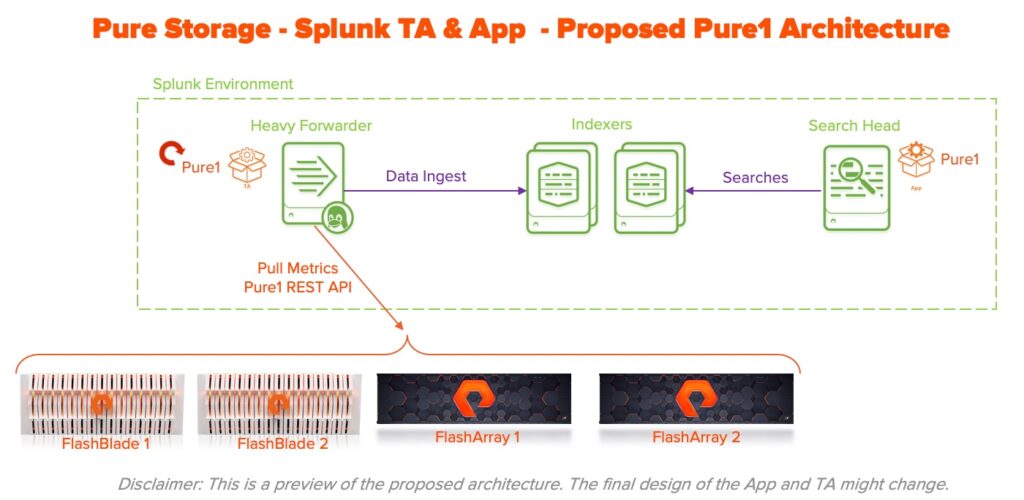
As you can see with the introduction of Pure1 REST API, the customer will have an option of configuring just one input to extract metric information from their fleet of Pure Storage appliances periodically. This will significantly improve their operational efficiency as well as reduce the overhead on the Splunk servers.
Even though this post is discussing Pure1 REST API in the context of Splunk, it is not limited to Splunk and the same model works for any other monitoring platform.
In the next part, I will go over the sequence of steps to configure Pure1 REST API and the authentication process. This would be useful for anyone who is interested in learning how to issue Pure1 REST API against various endpoints to gather performance metrics and array details.

